Posted 11 August 2023
(Editor's note: As at 22 August 2023, the returns for all investment options for 30 June 2023 were added to this article.)
The financial year ending 30 June 2023 was marked by resilience in global markets despite numerous challenges. High inflation, rising interest rates and geopolitical tensions, including the ongoing conflict in Ukraine, created a volatile environment.
Nevertheless, global share markets delivered strong returns characterised by price gains in a relatively small group of companies. In US markets, just seven companies (including Meta, Microsoft, and NVIDIA) produced nearly all of the gains over the six months to June 2023. This was driven by positive investor sentiment toward technology companies, fuelled by recent advances in artificial intelligence (AI) applications.
The Australian share market1 returned 14.4% over the year to June 2023 and international shares2 returned over 19.1%. Within international shares, US and European shares made strong gains, while the Japanese market saw a very strong rise. Chinese markets struggled, recording a negative return.
From a global perspective, the year was characterised by the highest inflation and fastest rate-hike cycle seen in developed economies for decades. Central banks around the world raised interest rates multiple times to curb inflation. Despite these measures, inflation remained high and economic growth started to slow.
Australia’s economy mirrored global trends, with high inflation and rising interest rates posing challenges for investors. The Reserve Bank of Australia (RBA) raised interest rates 12 times, from 0.1% to 4.1%, over the period May 2022 to June 2023. Despite this, unemployment remained at historically low levels and strong population growth contributed to positive economic growth.
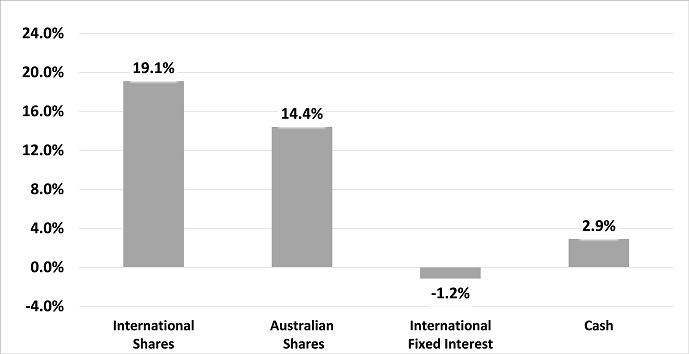
International Share Index = MSCI AC World ex-Aus TR Net Index 25% Hedged2
Australian Share Index = S&P/ASX 300 Accumulation Index1
International Fixed Interest Index = Bloomberg Barclays Global Aggregate Index (hedged)3
Cash Index = Bloomberg AusBond Bank Bill Index4
Our Balanced (MySuper) option returned 7.38% over the year to 30 June 2023. This was driven by returns in Australian and international shares, as well as in real assets, and positive but more modest performances from other asset classes.
All of our diversified options, except for the Conservative option, outperformed their 10-year Consumer Price Index (CPI) linked performance objectives to the end of June 2023. All of our single sector options outperformed their market-based performance objectives for the 10 years to June 2023.
The Balanced (MySuper) option’s positive performance was in keeping with other MySuper products over the year to June 2023, according to the SuperRatings Fund Crediting Rate Survey5. Its performance lagged the median of MySuper peers, however, over the same period. This was primarily due to the relatively higher positioning towards shares of our peers—by far the strongest performing asset class over the year.
Returns |
Accumulate Plus (MySuper) |
Retirement Access – Account-based pension (ABP) | Retirement Access – Transition to retirement income stream (TRIS) |
|---|---|---|---|
Quarter (%) |
1.67 |
1.53 |
1.33 |
1 year (%) |
7.38 |
7.43 |
6.37 |
5 year (% pa) |
4.62 |
4.99 |
4.39 |
10 year (% pa) |
6.01 |
6.70 |
n/a |
The outlook is expected to remain uncertain due to interest rate pressures and the potential resultant impact on economic growth as well as continuing geopolitical tensions. There are signs that inflation pressures are moderating, however, which could be a positive sign for investors.
Amidst this backdrop, we continue to favour a high degree of diversification in our diversified options, including our Balanced (MySuper) option. This includes exposure to a broad range of asset classes that benefit from a variety of economic drivers across different market environments, without over reliance on share markets to drive portfolio returns.
Below is a summary of investment returns for each of our investment options for 30 June 2023. Please remember that past performance is not a reliable indicator of future performance.
The returns shown below apply to Accumulate Plus, Retirement Access and Defined Benefit investment choice options. Note the returns for the Accumulate Plus and Defined Benefit options are listed under Super in the table. Accumulate Plus, Defined Benefit and the Retirement Access Transition to Retirement Income Stream (TRIS) returns are based on taxable unit prices and are shown after tax, investment fees and asset (percentage) based administration fees. Retirement Access account-based pension returns are based on non-taxable unit prices and are shown after investment fees and asset-based administration fees. Quarterly returns are not annualised.
| Division | Investment option | Quarter (%) | 1 year (%) | 5 years (% pa) | 10 years (% pa) |
| Accumulate Plus | Conservative | 0.15 | 3.37 | 2.20 | 3.40 |
| Moderate | 0.57 | 4.70 | 3.33 | 4.68 | |
| Balanced (MySuper) | 1.67 | 7.38 | 4.62 | 6.01 | |
| Growth | 2.21 | 8.28 | 5.39 | 7.08 | |
| Cash | 0.74 | 2.53 | 0.99 | 1.47 | |
| Fixed Interest | -1.22 | 1.60 | 0.85 | 1.84 | |
| Australian Shares | 3.09 | 16.52 | 8.22 | 9.07 | |
| International Shares | 3.80 | 14.11 | 7.93 | 10.37 |
| Division | Investment option | Quarter (%) | 1 year (%) | 5 years (% pa) | 10 years (% pa) |
| Retirement Access | Conservative | 0.16 | 3.92 | 2.63 | 3.94 |
| Moderate | 0.65 | 5.48 | 3.85 | 5.38 | |
| Balanced | 1.53 | 7.43 | 4.99 | 6.70 | |
| Growth | 2.50 | 9.62 | 6.03 | 7.91 | |
| Cash | 0.87 | 2.99 | 1.16 | 1.75 |
| Division | Investment option | Quarter (%) | 1 year (%) | 5 years (% pa) | 10 years (% pa) |
| Retirement Access (TRIS) | Conservative | 0.14 | 3.34 | 2.18 | n/a |
| Moderate | 0.53 | 4.64 | 3.27 | n/a | |
| Balanced | 1.33 | 6.37 | 4.39 | n/a | |
| Growth | 2.18 | 8.23 | 5.35 | n/a | |
| Cash | 0.75 | 2.54 | 0.99 | n/a |
This article was issued on 11 August 2023 by Commonwealth Bank Officers Superannuation Corporation Pty Limited (the trustee) (ABN 76 074 519 798, AFSL 246418), the trustee of Commonwealth Bank Group Super (the fund) (ABN 24 248 426 878). Past investment performance is not a reliable indicator of future performance. This document may include general advice but does not take into account your individual objectives, financial situation or needs. When assessing whether the information is appropriate for you, please consider the Product Disclosure Statement (PDS) and Reference Guides available from our website oursuperfund.com.au/pds. You should also consider seeking professional financial advice before finalising any decisions that may affect your financial future.