Posted 2 June 2023
The quarter to March 2023 was a strong one for traditional asset classes such as shares and bonds. The pace of central bank rate hikes slowed as inflation around the world started to ease from its high levels of growth witnessed throughout 2022.
Other factors such as stronger than expected economic activity data in the US and Europe, and the continued reopening of China also contributed to a somewhat positive outlook for the global economy. This outlook was reflected in sharemarket results over the quarter.
In terms of specific market events, the quarter saw the return of emerging turmoil within parts of the US regional banking sector. In an environment of rising interest rates around the world, the collapse of some US regional banks fuelled further sharemarket volatility. However, calmness was restored due to global sharemarket increases over the month of March and intervention by various central banks.
These events also contributed to a strong increase in bond valuations. Increased market expectation that central banks would slow or even reverse the recent increases in interest rates aided the growth in bond prices. Generally, bond prices tend to increase when the expectation is for interest rates to drop.
Fixed interest markets over the quarter also saw strong performance, largely driven by a decrease in inflation expectations and sharemarkets’ repricing of interest rate expectations.
The chart below provides this quarter’s benchmark returns for major assets classes. Following it is information about the US regional banking concerns and central bank interest rate activity.
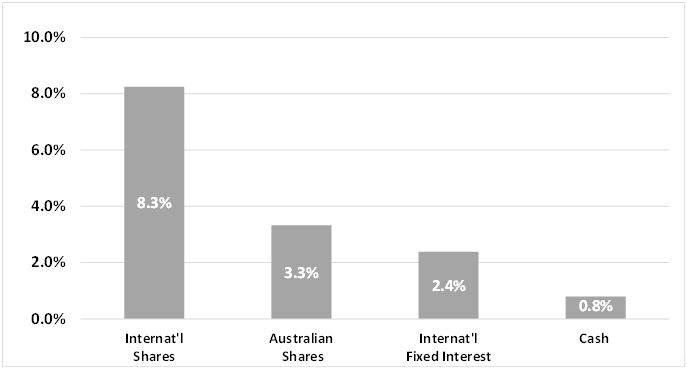
International Share Index = MSCI AC World ex-Aut TR Net Index 25% Hedged1
Australian Share Index = S&P / ASX 300 Accumulation Index2
International Fixed Interest Index = Bloomberg Barclays Global Aggregate Index (hedged)3
Cash Index = Bloomberg AusBond Bank Bill4
It was a strongly positive quarter for our Balanced (MySuper) option, which provided a net return of 2.96% over the quarter to 31 March 2023. Pleasingly, the rolling 1-year return figure is now in positive territory as shown in Chart 2.
Our diversified and single-sector options, except for the Conservative option, outperformed their 10-year Consumer Price Index (CPI) linked performance objectives to the end of March 2023. This outperformance was also achieved during a period of heightened CPI.
When compared to our MySuper peers, our Balanced (MySuper) option lagged the MySuper median for the March quarter. However, over the 1-year period to 31 March 2023 we have outperformed the MySuper median4.
Returns |
Accumulate Plus Balanced (MySuper) |
Retirement Access Balanced | Retirement Access Balanced TRIS |
|---|---|---|---|
Quarter (%) |
2.96 |
3.33 |
2.84 |
1 year (%) |
0.93 |
0.92 |
0.81 |
5 year (% pa) |
4.75 |
5.21 |
4.59 |
10 year (% pa) |
5.93 |
6.63 |
n/a |
For details of all our investment options’ performance, visit our investment returns page.
In early March, a number of US regional banks experienced significant depositor outflows over a short period, ultimately leading to the collapse of a handful of financial institutions.
These events were highly publicised, with echoes of the global financial crisis (GFC). Fears that these events could be a precursor to a new global banking crisis grew amongst depositors and investors around the world. Global share prices dropped, acutely so in the banking sector, and investors moved to defensive assets such as cash and bonds.
These fears eased in the weeks that followed. Central banks and governments intervened to protect depositors and to prevent further impacts. It became clear that these events were unique to these niche regional banks, rather than being an extensive banking sector issue.
Group Super had limited to no direct exposure to any of the impacted US banks. Our active share managers recognised some of the apparent weaknesses and reduced our exposure to the banking sector, in particular the US regional banking sector.
As with most super funds, our diversified and share options were initially affected by the indirect knock-on effects that these events had on the broader sharemarkets. The effect was largely reversed as calm was restored to markets in the weeks that followed. Global sharemarkets rose in March overall, increasing by 3.5%1.
Changes to global banking regulations following the GFC are believed to be sufficiently strong to reduce the risk of GFC-type events in the future. However, recent events demonstrate how smaller scale vulnerabilities within the financial system can be exposed when interest rates rise rapidly and significantly after a long period of relative stability. There are still risks that other global banks will suffer from the recent shift in interest rates. As mentioned previously, our advisers and investment managers monitor and consider these risks closely when making investment decisions on behalf of our fund.
Central banks around the world have been increasing interest rates at varying degrees over the last year. These rate hikes are designed to ‘cool’ high levels of inflation. As central banks adopt this approach economic growth and company profits are also expected to ‘cool’, creating a less positive outlook for growth assets such as shares.
We haven’t yet seen a significant slowdown in Australian or global economic growth. We do know that this cooling effect caused by interest rate hikes often is delayed, so we remain vigilant. An economic slowdown may be on its way in the near term. The timing of such a slowdown is always uncertain, and there is no crystal ball to tell us if it will be a ‘soft’ or ‘hard’ landing for economies.
It is also possible there may be further interest rate hikes as inflation remains well above long term averages. If this environment persists, central banks may be forced to act even more aggressively to meet their long term inflation targets.
With this outlook in mind, including the likelihood of continued market volatility, we remain focussed on providing appropriate exposure to long term growth assets while also diversifying our strategies across asset classes, geographies and sectors. This way we aim to ensure our members’ savings are not overly exposed to short term downside risks.
This article was issued on 2 June 2023 by Commonwealth Bank Officers Superannuation Corporation Pty Limited (the trustee) (ABN 76 074 519 798, AFSL 246418), the trustee of Commonwealth Bank Group Super (the fund) (ABN 24 248 426 878). Past investment performance is not a reliable indicator of future performance. This document may include general advice but does not take into account your individual objectives, financial situation or needs. When assessing whether the information is appropriate for you, please consider the Product Disclosure Statement (PDS) and Reference Guides available from our website oursuperfund.com.au/pds. You should also consider seeking professional financial advice before finalising any decisions that may affect your financial future.